CHASE Solar Hub pioneers liquid fuel conversion
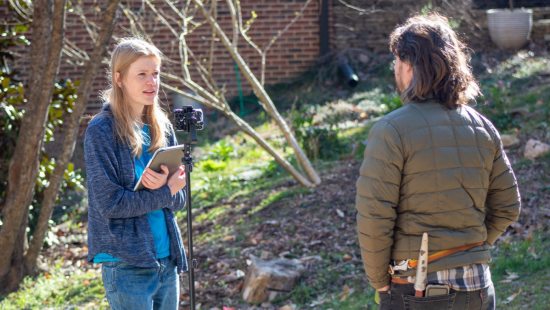
At the center's Chapel Hill headquarters, more than 100 researchers work to turn sunlight into methanol.
At the center's Chapel Hill headquarters, more than 100 researchers work to turn sunlight into methanol.
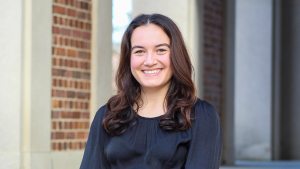
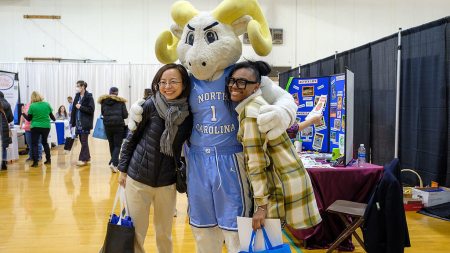
Since 2018, the program has helped 466 students explore careers in environment and sustainability.
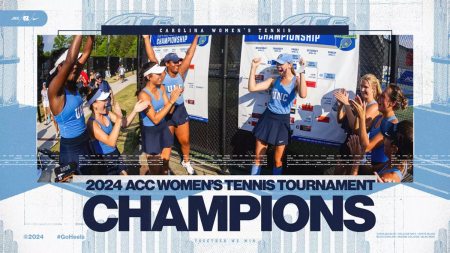
The Tar Heels defeated Virgnia Sunday, earning their first conference championship since 2021.
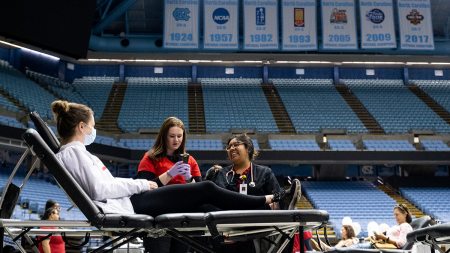
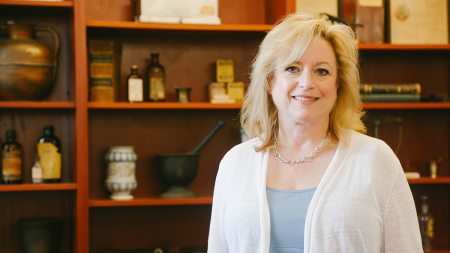
Librarian Lynn Eades overcame fear of needles to support the Carolina Blood Drive, coming May 1.
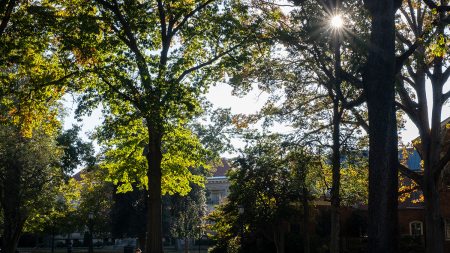
See climate’s impact on algae to zoos in Carolina Digital Repository’s curation of open access articles.
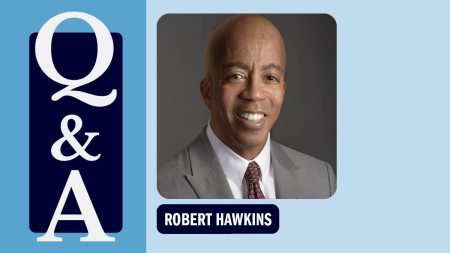
An associate dean at NC State, he will take on his role at the UNC School of Social Work on July 1.
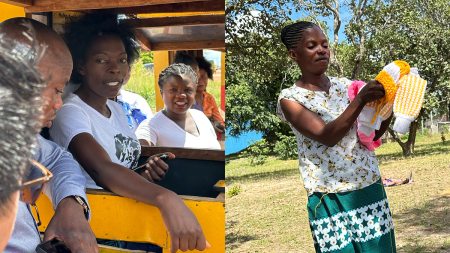
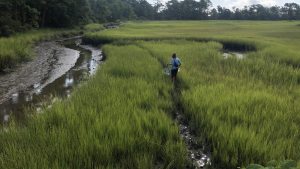
A UNC School of Social Work delegation saw how their research helped a nonprofit create jobs in rural areas.
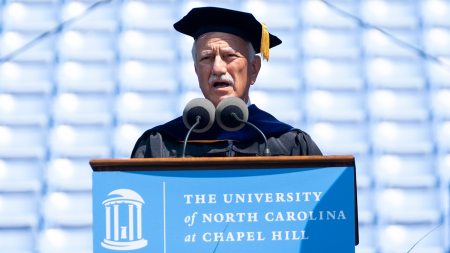
In a campus email, Lee H. Roberts wrote it's a privilege to interact with students and inspiring to learn about the diverse range of interests they're working on.

The New York Times
Bekah Brunstetter, best known for her work on “This Is Us,” discusses “The Game,” her new play premiering at UNC-Chapel Hill’s Playmaker’s Repertory Company.

Newsweek
Bob Goldstein, a tardigrade researcher at UNC-Chapel Hill, talks about his research on how tardigrades survive extreme environments.

WRAL
Gerald Cohen, the chief economist at UNC-Chapel Hill’s Kenan Flagler Business School, explains why your favorite grocery store items have become more expensive.
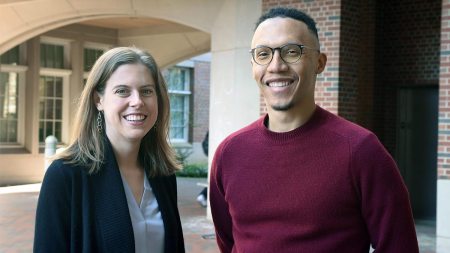
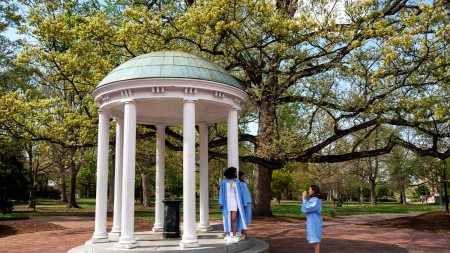
Abigail Knight and Sidney Wilkerson-Hill are the latest of 48 Tar Heels to receive this top award.
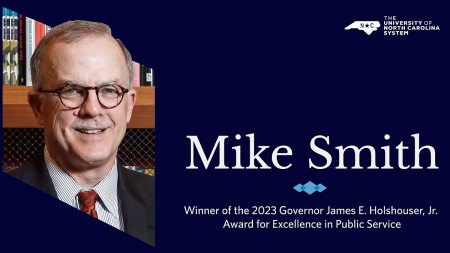
Mike Smith, former dean of the UNC School of Government, was honored for excellence in public service.
The national Walgreens Deans Advisory Council will collaborate on issues such as staffing and how to better utilize pharmacists to improve patient care.
Employees can stop by Fetzer Hall midday for free food, fitness classes, blood pressure checks and other activities.
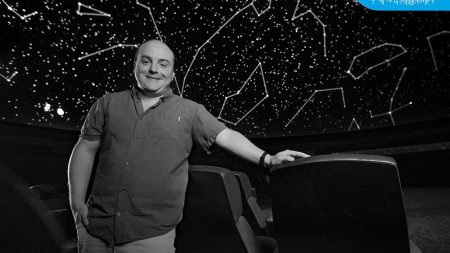
From high school volunteer to science educator, he has worked at Morehead Planetarium for 15 years.
Gary Marchionini’s 13 years at the helm of the School of Information and Library Science brought record growth.

Memorial Hall
Tue, April 2307:30 pm

The Friday Conference Center
Tue, April 3006:00 pm

Dean E. Smith Center
Wed, May 107:00 am

MoMo's Master
Sat, May 409:00 am