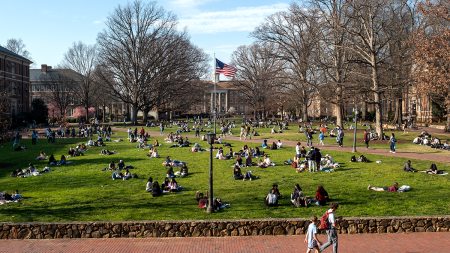
Trash Force picks up after campus
What started as an extra credit opportunity grew into a club who has fun keeping Carolina clean.
What started as an extra credit opportunity grew into a club who has fun keeping Carolina clean.
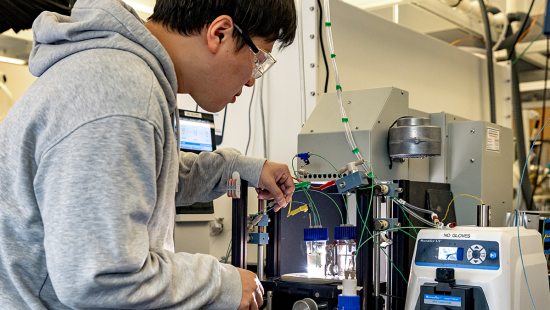
At the center's Chapel Hill headquarters, more than 100 researchers work to turn sunlight into methanol.

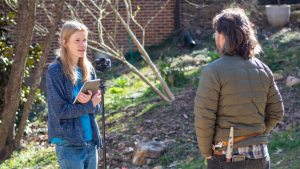
A new study from FPG researchers suggests preschoolers living near green space have better mental health.

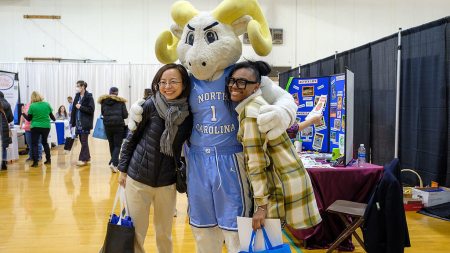
Tar Heels networked about foreign affairs careers through this UNC Global Affairs program.
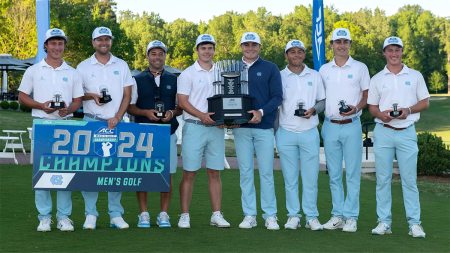
The Tar Heels defeated Florida State in Charlotte to earn their 12th conference championship.
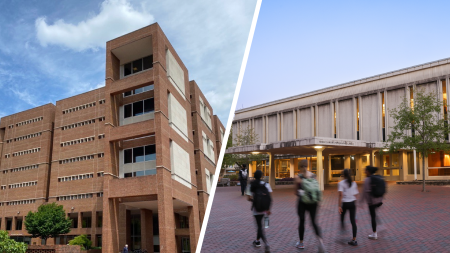
The popular services will relocate to the Undergraduate and Davis libraries, respectively, for greater access.
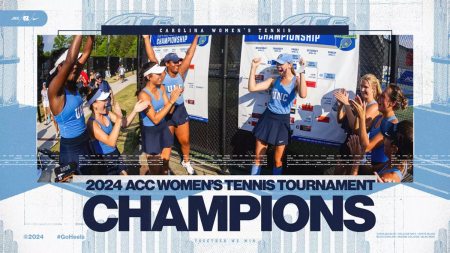
The Tar Heels defeated Virgnia Sunday, earning their first conference championship since 2021.
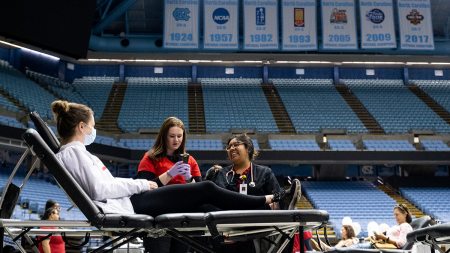
Librarian Lynn Eades overcame a fear of needles to support the Carolina Blood Drive, coming May 1.
The New York Times
Bekah Brunstetter, best known for her work on “This Is Us,” discusses “The Game,” her new play premiering at UNC-Chapel Hill’s Playmaker’s Repertory Company.

Newsweek
Bob Goldstein, a tardigrade researcher at UNC-Chapel Hill, talks about his research on how tardigrades survive extreme environments.
WRAL
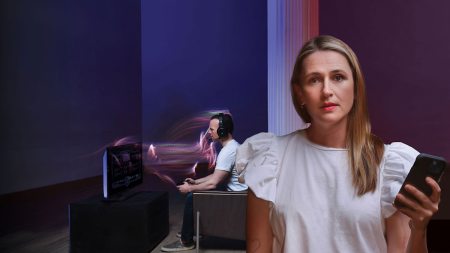
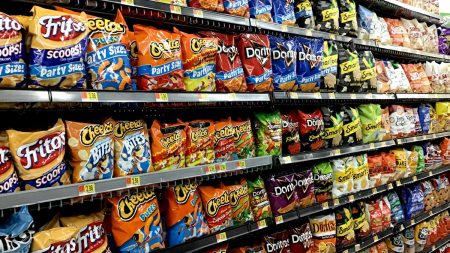
Gerald Cohen, the chief economist at UNC-Chapel Hill’s Kenan Flagler Business School, explains why your favorite grocery store items have become more expensive.
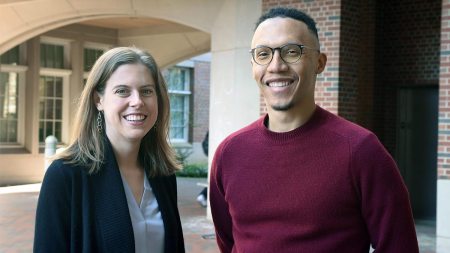
Abigail Knight and Sidney Wilkerson-Hill are the latest of 48 Tar Heels to receive this top award.
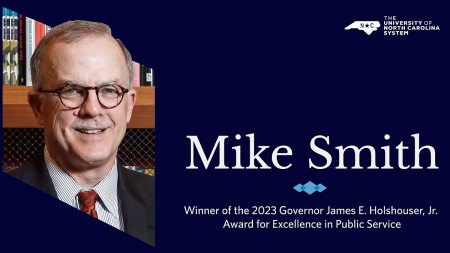
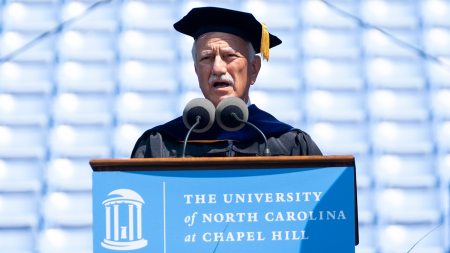
Mike Smith, former dean of the UNC School of Government, was honored for excellence in public service.
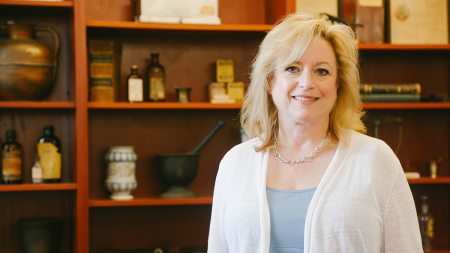
The national Walgreens Deans Advisory Council will collaborate on issues such as staffing and how to better utilize pharmacists to improve patient care.
Employees can stop by Fetzer Hall midday for free food, fitness classes, blood pressure checks and other activities.
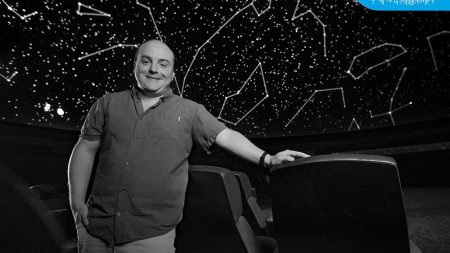
From high school volunteer to science educator, he has worked at Morehead Planetarium for 15 years.
Gary Marchionini’s 13 years at the helm of the School of Information and Library Science brought record growth.

Brooks Computer Science Building
Thu, April 2509:00 am
Brooks Computer Science Building
Fri, April 2609:15 am

Dean E. Smith Center
Wed, May 107:00 am

Grassy area in front of Wilson Library. Rain location: FedEx Global Education Center, 2nd Floor Atrium
Thu, May 212:00 pm